Fig. 1
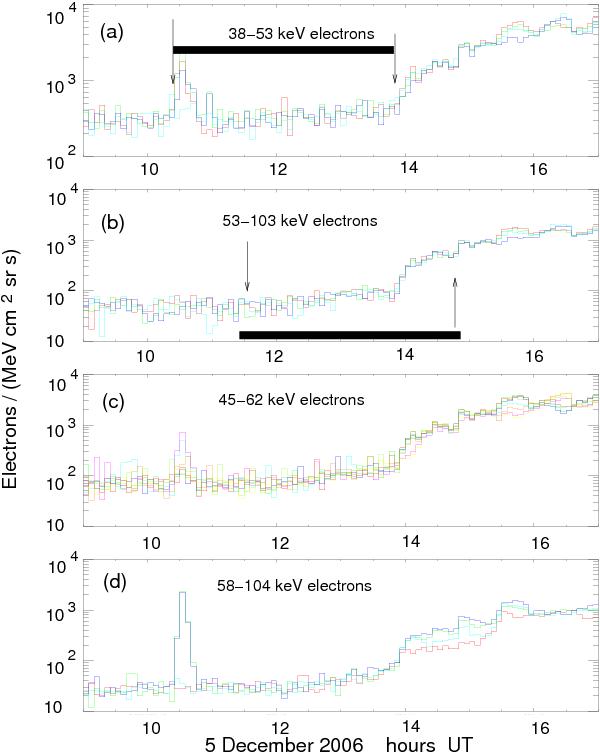
The onset of the precursor and the main event at ACE. The upper trace a) shows the four sectors of the deflected electrons (DE1); and b) shows the same, but for channel DE2. The arrows in a) are drawn at 10:27 UT on 5 December, 2006, and 13:50 UT. Trace c) shows the eight sectors of the LEFS60 channel E1′; and d) shows the LEFS150 E2 channel (see text for discussion of energy channel boundaries). The arrows in b) are drawn at the onset times of the precursor (11:30 UT) and the main event (14:45 UT) at STEREO (Mewaldt et al. 2009). The dark bar in a) covers the time between the precursor and the main event onsets and is exactly reproduced in b). The data are plotted as 5 min averages and the nominal energy band is indicated in each plot (see text).
Current usage metrics show cumulative count of Article Views (full-text article views including HTML views, PDF and ePub downloads, according to the available data) and Abstracts Views on Vision4Press platform.
Data correspond to usage on the plateform after 2015. The current usage metrics is available 48-96 hours after online publication and is updated daily on week days.
Initial download of the metrics may take a while.