Free Access
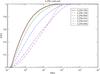
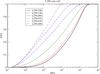
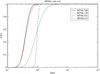
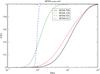
Fig. 7
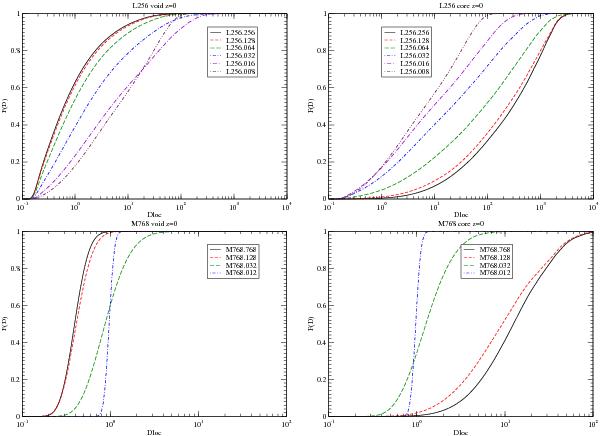
The cumulative distributions of the local densities for particles in the void and core regions for the present epoch z = 0 are given in the left and the right panels, respectively. The upper row is for the L256 models, the lower row for the M768 models. Models with various cutoff scale of the power spectra are shown.
This figure is made of several images, please see below:
Current usage metrics show cumulative count of Article Views (full-text article views including HTML views, PDF and ePub downloads, according to the available data) and Abstracts Views on Vision4Press platform.
Data correspond to usage on the plateform after 2015. The current usage metrics is available 48-96 hours after online publication and is updated daily on week days.
Initial download of the metrics may take a while.