Fig. 1
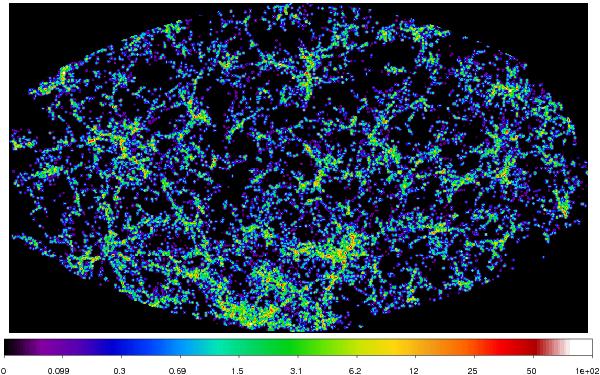
The luminosity density field of the SDSS in a spherical shell of 10 h-1 Mpc thickness at a distance of 240 h-1 Mpc. To enhance the faint filaments in voids between the superclusters, the density scale is logarithmic, in units of the mean luminosity density for the whole DR7. The rich complex in the lower area of the picture is part of the Sloan Great Wall; it consists of two very rich superclusters, SCL 111 and SCL 126 in the list by Einasto et al. (2001). The coordinates x,y are defined by Eqs. (1) and (2). A cellular distribution of superclusters and filaments of various richness can be clearly seen.
Current usage metrics show cumulative count of Article Views (full-text article views including HTML views, PDF and ePub downloads, according to the available data) and Abstracts Views on Vision4Press platform.
Data correspond to usage on the plateform after 2015. The current usage metrics is available 48-96 hours after online publication and is updated daily on week days.
Initial download of the metrics may take a while.