Free Access
Fig. 8
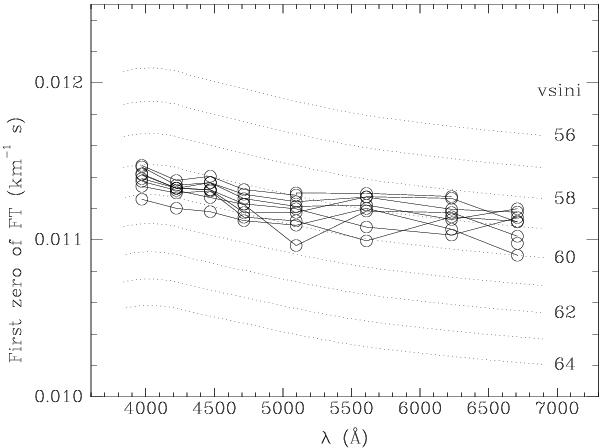
Position of the first zero of the FT of the rotational profiles for 8 spectral regions of 8 spectra of the star HD 77370. Dotted lines are theoretical lines corresponding to different values of vsini and have been calculated from the limb darkening coefficients in Díaz-Cordovés et al. (1995).
Current usage metrics show cumulative count of Article Views (full-text article views including HTML views, PDF and ePub downloads, according to the available data) and Abstracts Views on Vision4Press platform.
Data correspond to usage on the plateform after 2015. The current usage metrics is available 48-96 hours after online publication and is updated daily on week days.
Initial download of the metrics may take a while.