Fig. 6
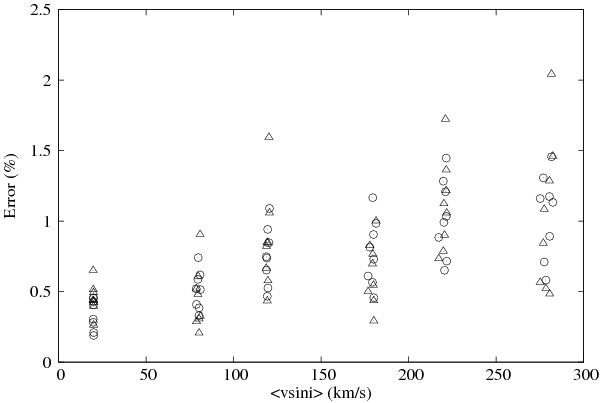
Percentage error on ⟨ vsini ⟩ from single regions of artificially broadened spectra. For each velocity two values of S/N are plotted. S/N = 100 and 200 for ⟨ vsini ⟩ = 80, 180, and 280 km s-1. S/N = 100 and 70 for ⟨ vsini ⟩ = 20, 120, and 220 km s-1. Triangles: standard deviation of 10 consecutive measures (true error). Circles: designated error (calibration).
Current usage metrics show cumulative count of Article Views (full-text article views including HTML views, PDF and ePub downloads, according to the available data) and Abstracts Views on Vision4Press platform.
Data correspond to usage on the plateform after 2015. The current usage metrics is available 48-96 hours after online publication and is updated daily on week days.
Initial download of the metrics may take a while.