Fig. 4
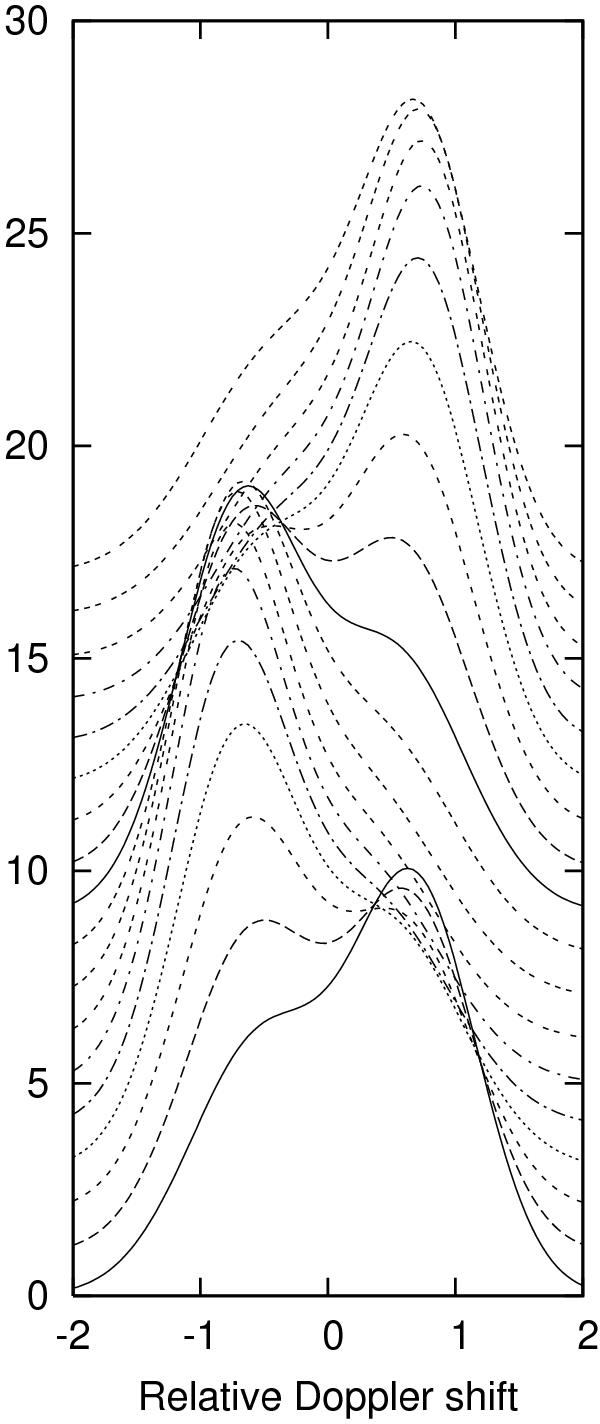
Model spectra for He I, generated every 20° of orbital phase. The lowest spectrum is for orbital phase 0; successive spectra are successively displaced upwards by 1. The top spectrum is for 340° and the model spectrum shown in Fig. 2 immediately precedes it. The model spectrum shown in Fig. 3 is also included. This compilation can be compared with the observed spectra in Fig. 2 of Blundell & Schmidtobreick (2006).
Current usage metrics show cumulative count of Article Views (full-text article views including HTML views, PDF and ePub downloads, according to the available data) and Abstracts Views on Vision4Press platform.
Data correspond to usage on the plateform after 2015. The current usage metrics is available 48-96 hours after online publication and is updated daily on week days.
Initial download of the metrics may take a while.