Fig. 2

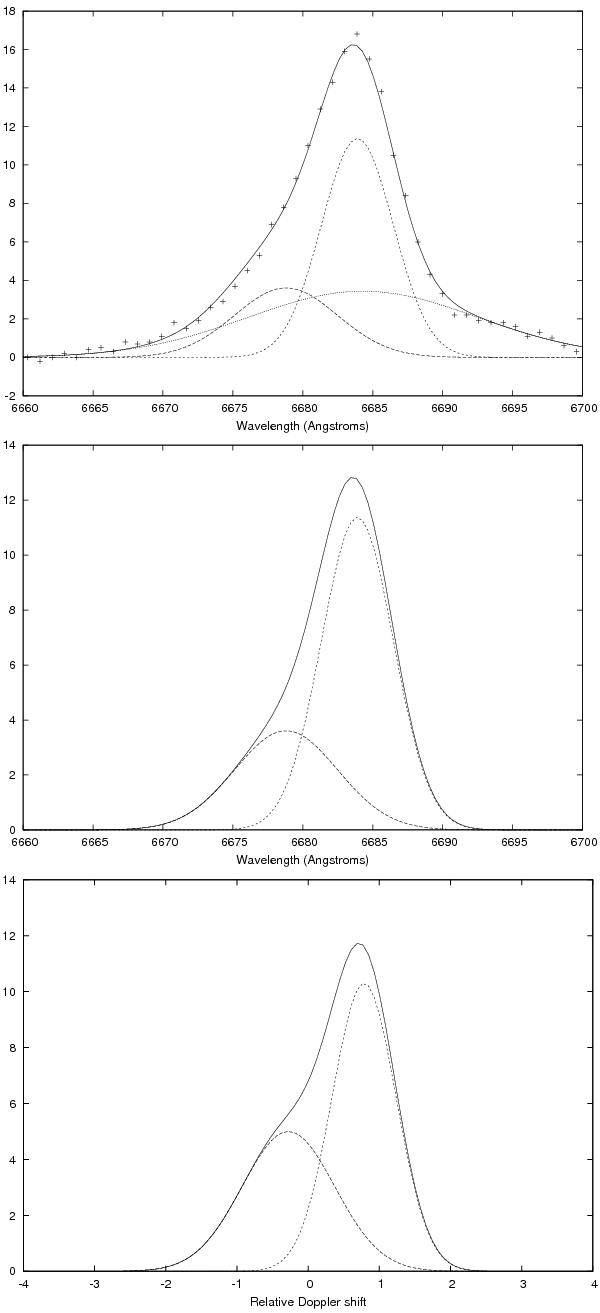
Quality of the He data and of its decomposition in terms of Gaussian components. The upper panel displays the digitised He I 6678 Å spectrum for JD +253.5, close to the extreme red shift exhibited, together with the three components of the fit and the resulting envelope. The middle panel shows the two narrow components and their resultant, the broadest Gaussian having been stripped out. The lowest panel is the result of analysing the spectrum from the model described in the text, for approximately the same extreme. The system is about 1.4 days before orbital phase zero. No attempt has been made to fit the model in detail but the similarity between the modelled spectrum and the reduced data shown in the middle panel is evident. A comparison of the various panels shows that the relative Doppler shift for x = 1 corresponds to red shift of above 200 km s-1.
Current usage metrics show cumulative count of Article Views (full-text article views including HTML views, PDF and ePub downloads, according to the available data) and Abstracts Views on Vision4Press platform.
Data correspond to usage on the plateform after 2015. The current usage metrics is available 48-96 hours after online publication and is updated daily on week days.
Initial download of the metrics may take a while.


