Free Access
Fig. 2
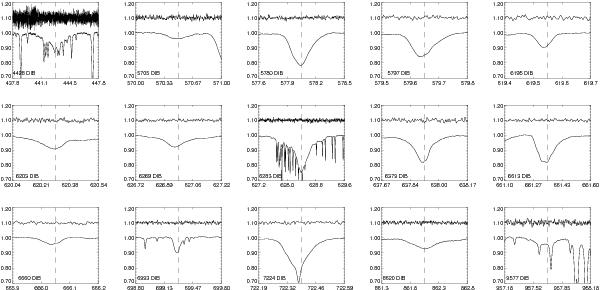
Total normalized intensity I and polarisation ΔP spectra of 15 strongest DIBs toward HD 194279. The ΔP spectra are scaled 10 × and displaced vertically for display. DIB rest wavelengths from Hobbs et al. (2008), corrected for radial velocity of K i, are shown as dashed vertical lines.
Current usage metrics show cumulative count of Article Views (full-text article views including HTML views, PDF and ePub downloads, according to the available data) and Abstracts Views on Vision4Press platform.
Data correspond to usage on the plateform after 2015. The current usage metrics is available 48-96 hours after online publication and is updated daily on week days.
Initial download of the metrics may take a while.