Free Access
Fig. 3
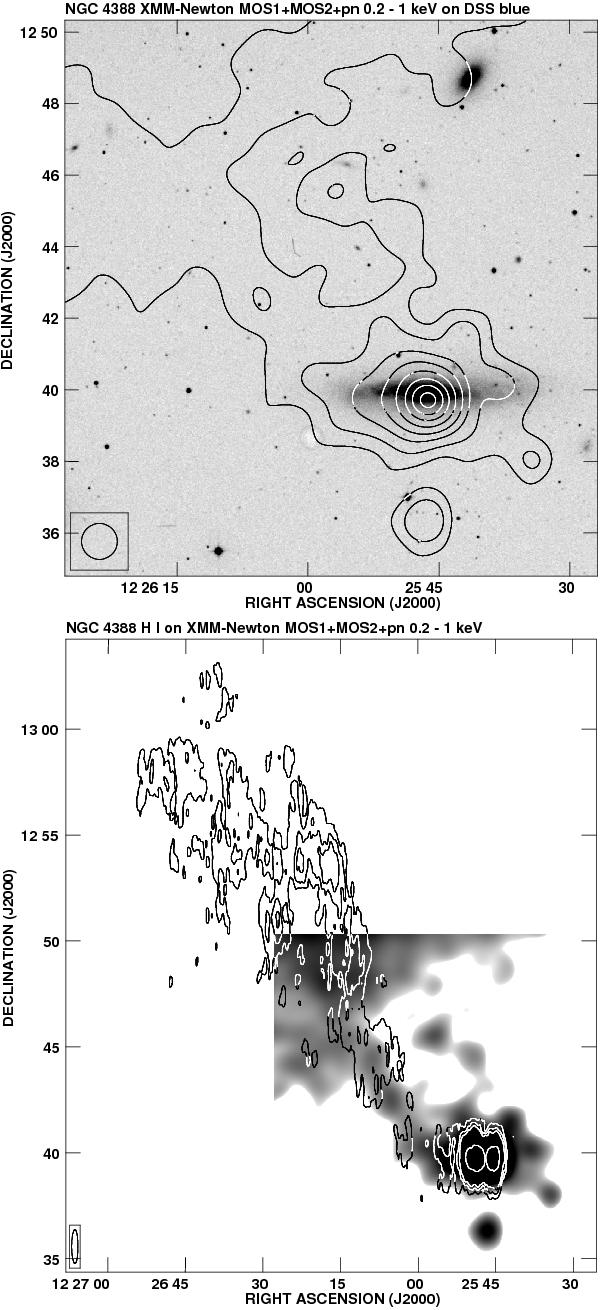
X-ray emission (0.2–1 keV) of NGC 4388, together with an optical B band image (upper panel) and the Hi map from Oosterloo & van Gorkom (2005; lower panel). The X-ray map was cut at the position, where contribution from the M 86 halo starts to dominate. The first greyscale corresponds to 7 times the rms noise level.
This figure is made of several images, please see below:
Current usage metrics show cumulative count of Article Views (full-text article views including HTML views, PDF and ePub downloads, according to the available data) and Abstracts Views on Vision4Press platform.
Data correspond to usage on the plateform after 2015. The current usage metrics is available 48-96 hours after online publication and is updated daily on week days.
Initial download of the metrics may take a while.