Fig. 1
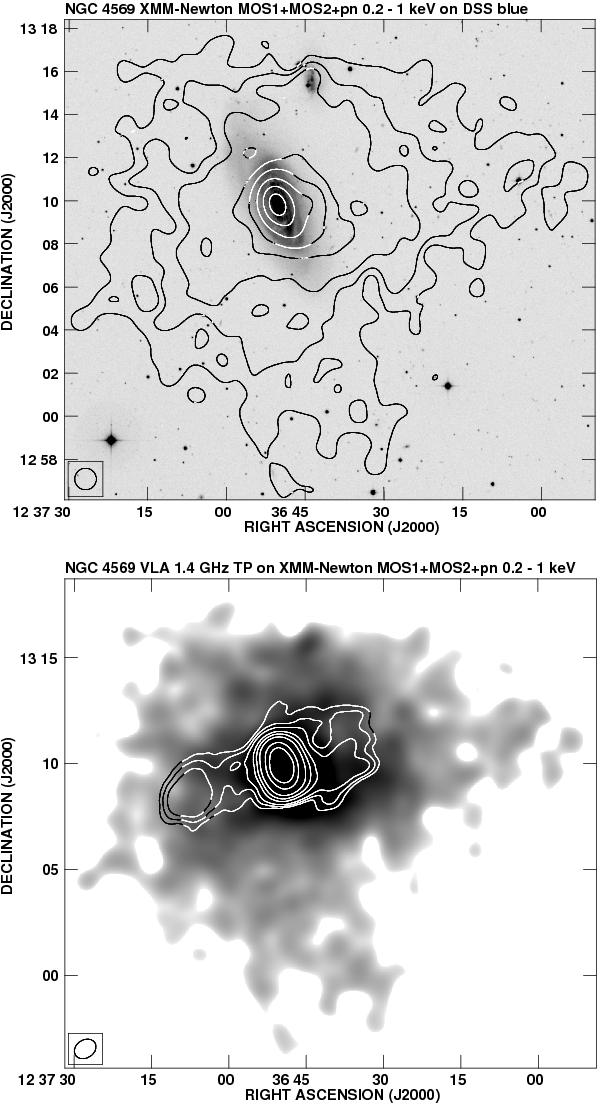
X-ray emission (0.2–1 keV) of NGC 4569, together with an optical B band (upper panel) and the radio total power map at 1.4 GHz from Chyży et al. (2006; lower panel). The resolution of both maps is 1′. The beam size is shown in the bottom left corner of the figure. The first greyscale in the lower panel corresponds to 3 times the rms noise level. The radio contour levels are 3, 5, 8, 16, 25, 40, 80, 120 × 0.24 mJy.
Current usage metrics show cumulative count of Article Views (full-text article views including HTML views, PDF and ePub downloads, according to the available data) and Abstracts Views on Vision4Press platform.
Data correspond to usage on the plateform after 2015. The current usage metrics is available 48-96 hours after online publication and is updated daily on week days.
Initial download of the metrics may take a while.