Free Access
Fig. 4
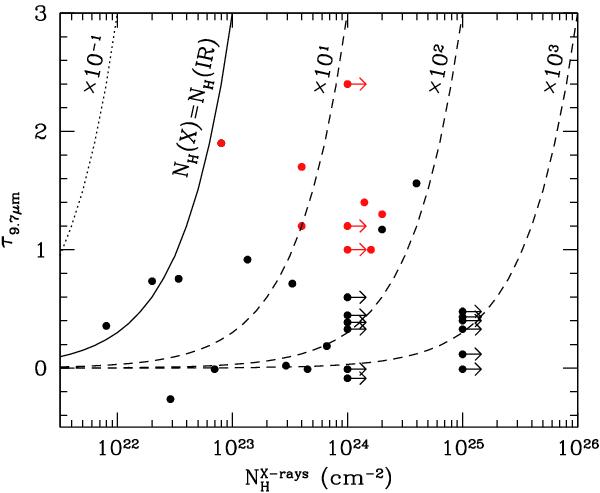
Optical depth at 9.7 μm versus X-ray hydrogen column density for the Shi et al. (2006) sample (black points) and the optically-thick AGN in the IRAS sample of Wu et al. (2009) (red points). The solid line marks the region where the X-ray NH equals that inferred from τ9.7, assuming a Milky-Way extinction curve.
Current usage metrics show cumulative count of Article Views (full-text article views including HTML views, PDF and ePub downloads, according to the available data) and Abstracts Views on Vision4Press platform.
Data correspond to usage on the plateform after 2015. The current usage metrics is available 48-96 hours after online publication and is updated daily on week days.
Initial download of the metrics may take a while.