Fig. 3
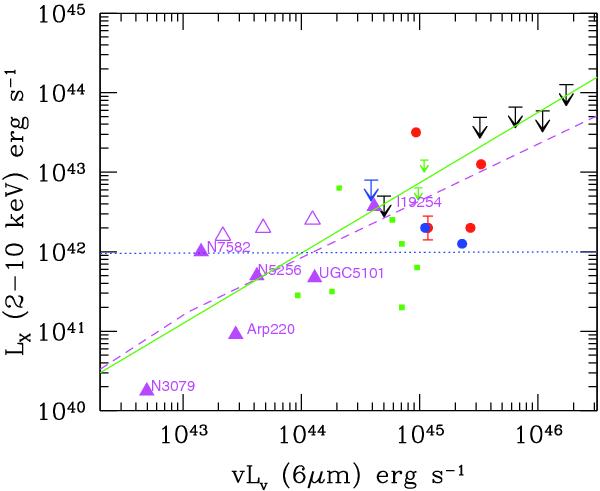
Rest-frame (uncorrected for absorption) LX versus L6 μm luminosity diagram. The filled triangles correspond to the Compton-thick AGN in the 12 μm sample, while the open triangles correspond to the three heavily obscured but not Compton-thick AGN in the same sample. The red (blue) filled circles or upper limits denote the high-τ sources in the CDF-N (CDF-S). The black upper limits denote the FLS points. Finally, the green points (filled squares and small upper limits) denote the sources with considerable PAH emission that have not been included in our sample. The dash line (magenta) denotes the low LX/L6 μm area that should be populated by Compton-thick AGN. This line is derived from the average LX/L6 μm relation derived for the COSMOS AGN (Fiore et al. 2009) by scaling it down by a factor 0.03, which corresponds to the average flux of the reflection component in the 2−10 keV band relative to the intrinsic power-law component in local Compton-thick AGN (Comastri 2004). The solid line (green) corresponds to the luminosity-dependent Compton-thick line based on the Maiolino et al. (2007) relation, scaled down by the same amount. Finally, the horizontal dotted line at LX = 1042 erg s-1 denotes the upper limit to X-ray emission due to star-forming processes (Tzanavaris et al. 2006).
Current usage metrics show cumulative count of Article Views (full-text article views including HTML views, PDF and ePub downloads, according to the available data) and Abstracts Views on Vision4Press platform.
Data correspond to usage on the plateform after 2015. The current usage metrics is available 48-96 hours after online publication and is updated daily on week days.
Initial download of the metrics may take a while.