Fig. 7
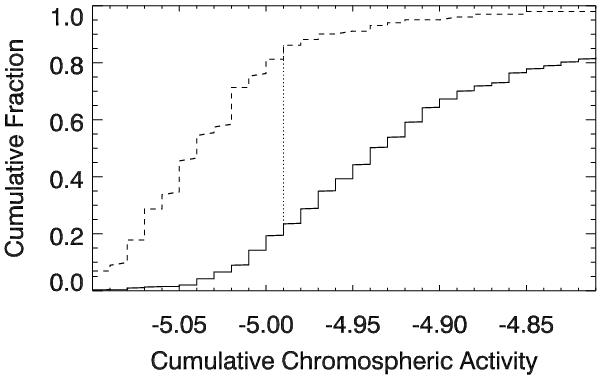
The cumulative distributions for both main sequence (solid curve) and subgiant stars (dashed curve) as a function of the cumulative chromospheric activity. The dotted vertical line represents the largest deviation between the distributions and hence relates to the KS test D statistic. Clearly both these populations are not drawn from the same parent distribution at a high level of significance.
Current usage metrics show cumulative count of Article Views (full-text article views including HTML views, PDF and ePub downloads, according to the available data) and Abstracts Views on Vision4Press platform.
Data correspond to usage on the plateform after 2015. The current usage metrics is available 48-96 hours after online publication and is updated daily on week days.
Initial download of the metrics may take a while.