Fig. 6

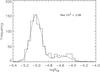
The top panel shows the distribution of  for our full sample of stars. Most stars are located around the inactive part of the distribution (≤ −4.8). We note there is a lack of stars around the Vaughan Preston gap and then a slight indication of the expected secondary active bump in this bimodal distribution. We overplot the best fit bimodal function by the dashed curve and highlight the reduced χ2 of 2.08 we find. The lower panel shows the sample split by main sequence stars (black) and subgiants (green). The subgiants occupy a more inactive state than the main sequence stars.

Current usage metrics show cumulative count of Article Views (full-text article views including HTML views, PDF and ePub downloads, according to the available data) and Abstracts Views on Vision4Press platform.
Data correspond to usage on the plateform after 2015. The current usage metrics is available 48-96 hours after online publication and is updated daily on week days.
Initial download of the metrics may take a while.