Fig. 4
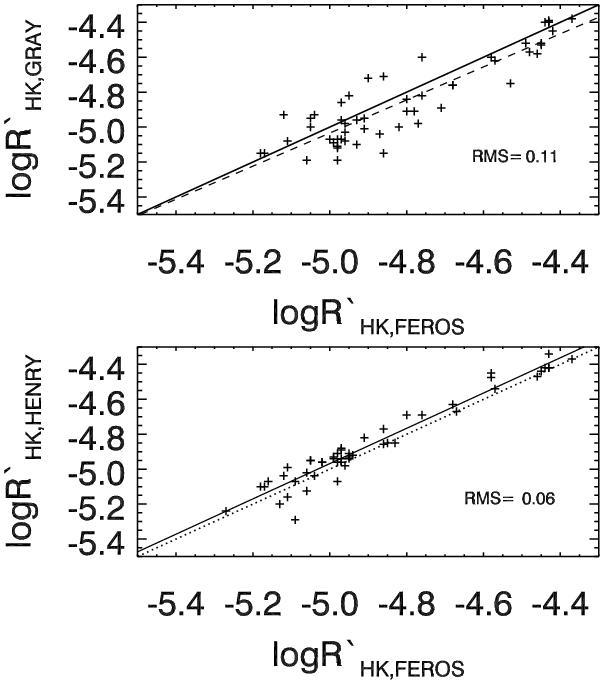
Comparison between our FEROS chromospheric activities and those in Gray et al. (2006) is shown in the top panel. There is a large amount of scatter in this plot (0.11), which is significantly larger than the intrinsic rms we found from our calibration stars (0.04). However, there is no significant trend, as shown by the best fit straight line (solid line) compared to the dashed 1:1 relationship. The lower panel shows the same comparison but against the published values of Henry et al. (1996) where an offset is apparent. The offset only seems apparent for moderate to active stars.
Current usage metrics show cumulative count of Article Views (full-text article views including HTML views, PDF and ePub downloads, according to the available data) and Abstracts Views on Vision4Press platform.
Data correspond to usage on the plateform after 2015. The current usage metrics is available 48-96 hours after online publication and is updated daily on week days.
Initial download of the metrics may take a while.