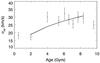
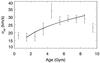
Fig. 18

Binned total kinematic velocities for our sample as a function of age derived using the chromospheric activities. The uncertainties are from Poisson statistics. The top panel shows the fit where the bins contain equal numbers of stars and the lower panel is binned in 1 Gyr intervals. The solid curve represents the best fit power law, parameterising the disk-heating exponent as a function of time. The dashed line is the best fit theoretical disk-heating model with a power law index of 0.349 (Aumer & Binney 2009).
Current usage metrics show cumulative count of Article Views (full-text article views including HTML views, PDF and ePub downloads, according to the available data) and Abstracts Views on Vision4Press platform.
Data correspond to usage on the plateform after 2015. The current usage metrics is available 48-96 hours after online publication and is updated daily on week days.
Initial download of the metrics may take a while.