Fig. 17
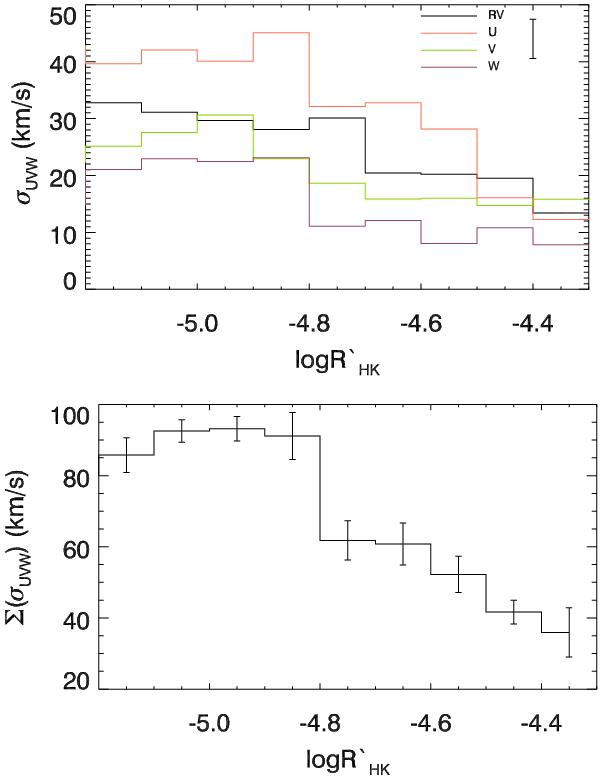
The top panel shows histograms of the standard deviation of RV, U, V and W in binned activity regions, along with the average uncertainty. This plot better highlights the increase in the dispersion of kinematic motion vectors as a function of decreasing chromospheric activity, and hence increase in time. The step up to large dispersion and a flat distribution is seen in all histograms. The lower panel shows the binned totals of the standard deviations for U, V and W space velocities. This allows a clearer picture of the step after the Vaughan-Preston gap region.
Current usage metrics show cumulative count of Article Views (full-text article views including HTML views, PDF and ePub downloads, according to the available data) and Abstracts Views on Vision4Press platform.
Data correspond to usage on the plateform after 2015. The current usage metrics is available 48-96 hours after online publication and is updated daily on week days.
Initial download of the metrics may take a while.