Free Access
Fig. 14
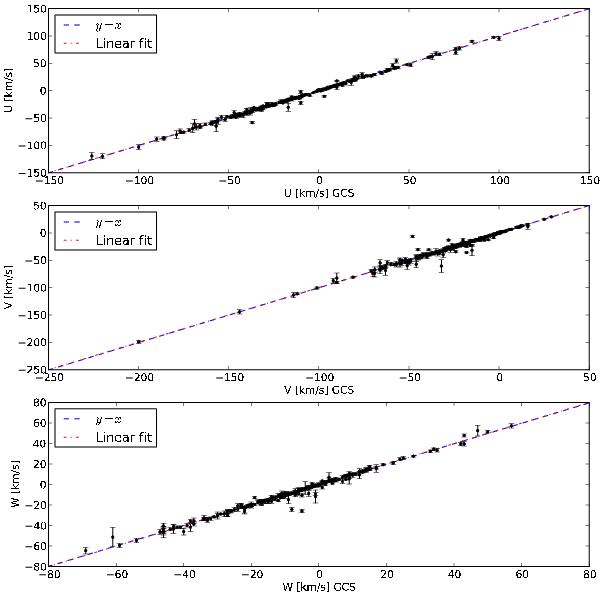
A comparison between our measured UVW kinematic velocities and those of the GCS, from top to bottom respectively. All three also show the 1:1 relationship (red dot-dashed line) and the best fit to the data (blue dashed line). All three agree with those measured by the GCS with only a few outliers.
Current usage metrics show cumulative count of Article Views (full-text article views including HTML views, PDF and ePub downloads, according to the available data) and Abstracts Views on Vision4Press platform.
Data correspond to usage on the plateform after 2015. The current usage metrics is available 48-96 hours after online publication and is updated daily on week days.
Initial download of the metrics may take a while.