Fig. 13
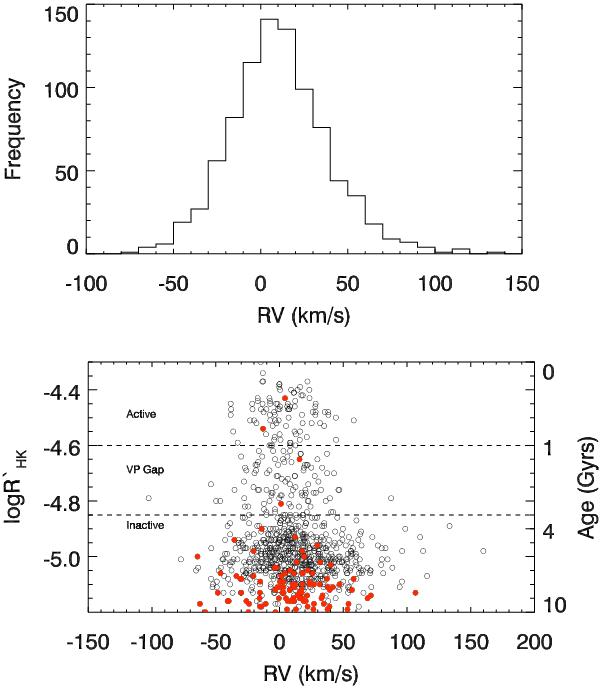
The top panel shows the histogram of binned radial-velocities for the sample. The sample peaks around 5 km s-1 and follows a Gaussian distribution. The lower panel shows the chromospheric activities as a function of radial-velocity and age on the right hand y-axis. Open circles are main sequence stars and filled red circles are the subgiant stars. Dashed lines bound the active, inactive and Vaughan Preston gap stars. We find an increase in the dispersion over the gap region of ~10 km s-1.
Current usage metrics show cumulative count of Article Views (full-text article views including HTML views, PDF and ePub downloads, according to the available data) and Abstracts Views on Vision4Press platform.
Data correspond to usage on the plateform after 2015. The current usage metrics is available 48-96 hours after online publication and is updated daily on week days.
Initial download of the metrics may take a while.