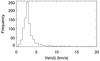
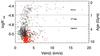
Fig. 11

The top panel shows the histogram of binned rotational velocities for the whole sample. The sample peaks around 2.5 km s-1 with a tail of faster rotating stars. The lower panel shows the chromospheric activities as a function of rotational velocity with the main sequence stars as open circles and subgiants are filled red circles. Given these two quantities are correlated, due to the wind braking mechanism invoked to explain the activity distribution of such stars, we find an expected relationship whereby the stars that are deemed fast rotators are mostly found to have high  activity indices. The dashed lines bound the VP gap and the minimum measurable vsini is found to be 1.5 km s-1.
Current usage metrics show cumulative count of Article Views (full-text article views including HTML views, PDF and ePub downloads, according to the available data) and Abstracts Views on Vision4Press platform.
Data correspond to usage on the plateform after 2015. The current usage metrics is available 48-96 hours after online publication and is updated daily on week days.
Initial download of the metrics may take a while.