Fig. 6
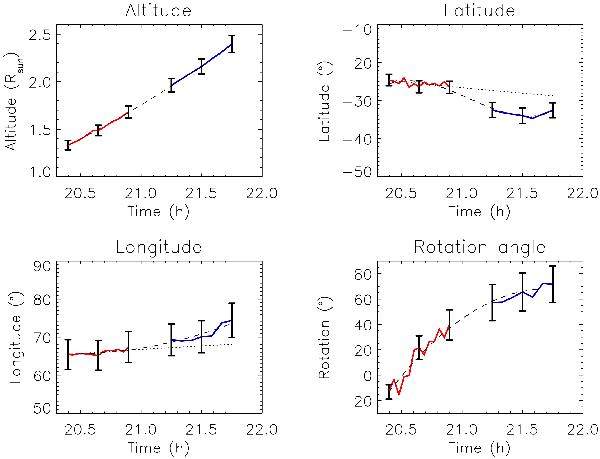
Time evolution of the prominence top altitude (top left panel), average latitude (top right), average longitude (bottom left) and rotation angle (bottom right) as derived from EUVI (red solid lines) and COR1 (blue solid lines) data. Dashed lines in each panel refer to second order polynomial fits to the observed curves. Dotted lines show the latitudinal and longitudinal trends expected for an eruption expanding along a linear trajectory not aligned with the radial direction.
Current usage metrics show cumulative count of Article Views (full-text article views including HTML views, PDF and ePub downloads, according to the available data) and Abstracts Views on Vision4Press platform.
Data correspond to usage on the plateform after 2015. The current usage metrics is available 48-96 hours after online publication and is updated daily on week days.
Initial download of the metrics may take a while.