Fig. 4
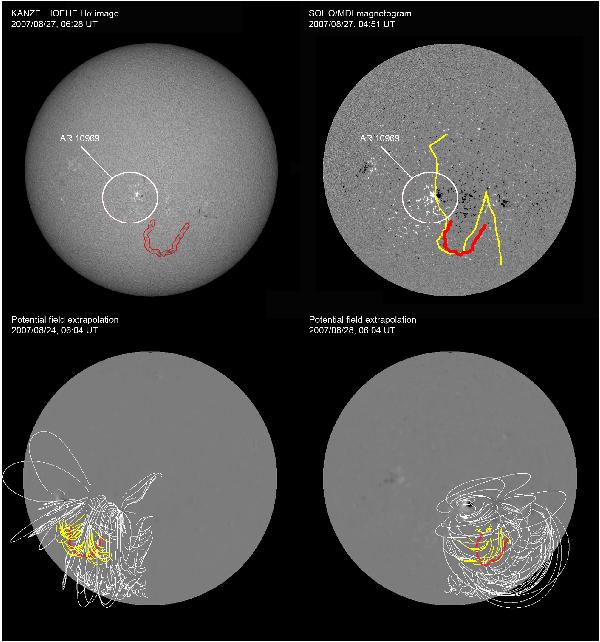
Overall magnetic field configuration before the August 31 eruption. Top left: Kanzelhöhe Hα image acquired on August 27 showing the relative position of the filament (surrounded by a red line) and the active region (white circle). Top right: SOHO/MDI photospheric magnetic field map on August 27 showing the position of the filament (red line) with respect to the different magnetic field polarities and to the magnetic neutral line (yellow line, from the Wilcox Solar Observatory). Bottom: potential field extrapolations as derived for August 24 (left) and August 28 (right) showing the position of closed fieldlines overlying the active region and the Hα filament (red line).
Current usage metrics show cumulative count of Article Views (full-text article views including HTML views, PDF and ePub downloads, according to the available data) and Abstracts Views on Vision4Press platform.
Data correspond to usage on the plateform after 2015. The current usage metrics is available 48-96 hours after online publication and is updated daily on week days.
Initial download of the metrics may take a while.