Fig. 5
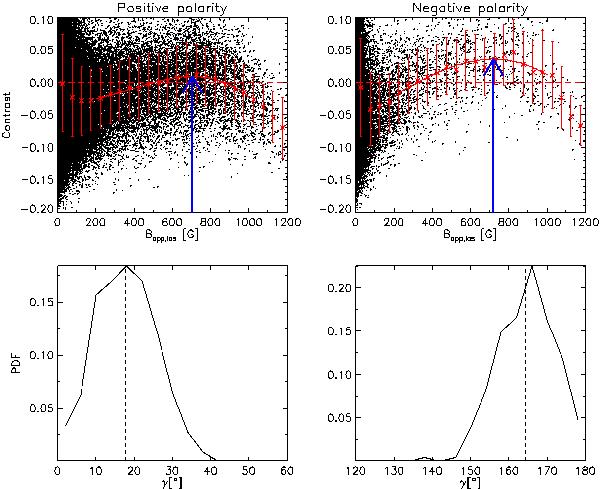
Upper panels: scatterplot of continuum contrast vs. Bapp,los for the positive and negative polarity in the FOV displayed in Fig. 4. Symbols are as in Fig. 2. Lower panels: probability distribution functions of the inclination γ retrieved by the inversion for the positive (between 0° and 90°) and negative (between 90° and 180°) polarity.
Current usage metrics show cumulative count of Article Views (full-text article views including HTML views, PDF and ePub downloads, according to the available data) and Abstracts Views on Vision4Press platform.
Data correspond to usage on the plateform after 2015. The current usage metrics is available 48-96 hours after online publication and is updated daily on week days.
Initial download of the metrics may take a while.