Fig. 1
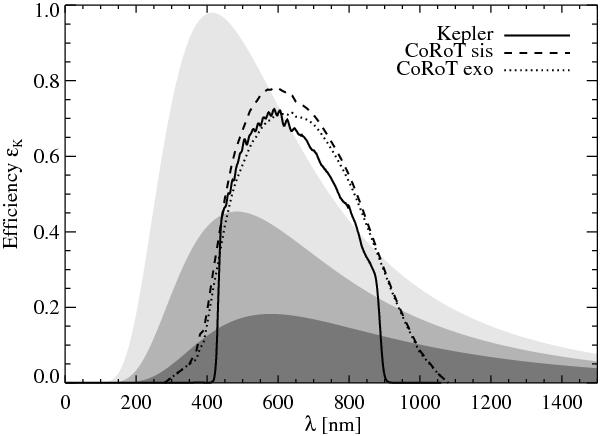
A solid line shows the spectral response ℰK of Kepler as a function of the wavelength λ (after Van Cleve et al. 2009), whereas dotted and dashed lines show the spectral responses of CoRoT seismo- and exofield (Auvergne et al. 2009). Grey profiles indicate the spectra (in arbitrary units) of black bodies with temperatures of 7000, 6000, and 5000 K, from top to bottom.
Current usage metrics show cumulative count of Article Views (full-text article views including HTML views, PDF and ePub downloads, according to the available data) and Abstracts Views on Vision4Press platform.
Data correspond to usage on the plateform after 2015. The current usage metrics is available 48-96 hours after online publication and is updated daily on week days.
Initial download of the metrics may take a while.