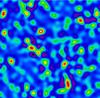
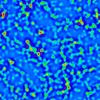
Fig. 6
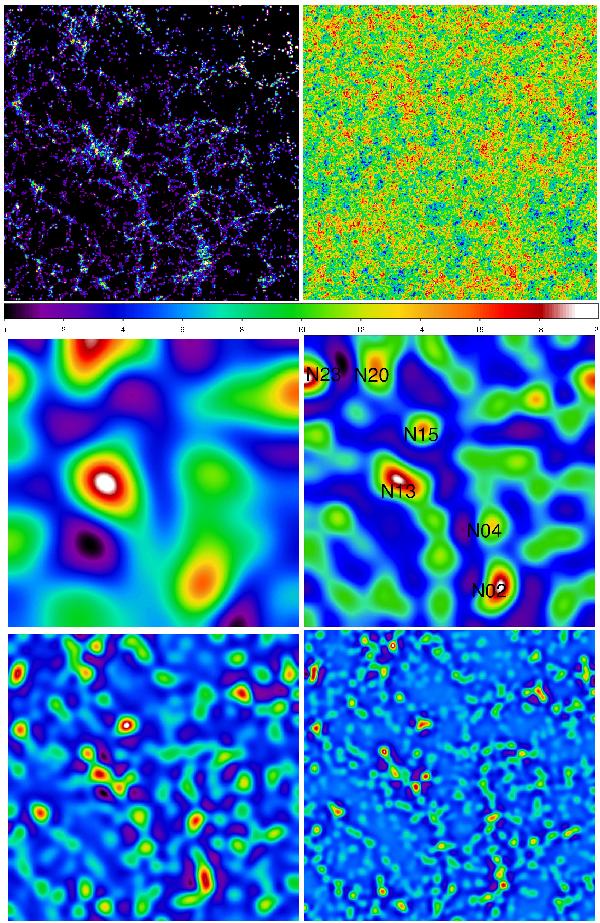
Upper left panel shows a two-dimensional rectangular region of size 512 × 512 Mpc (using Hubble constant h = 0.8), extracted from the high-resolution luminosity density field of the Northern equatorial wedge of the SDSS. The density was calculated using Gaussian smoothing with the rms scale 0.8 Mpc. The observer is located at the lower left corner. Colour-coded density levels used in plotting are in the interval from 0 to 10 in mean density units with the highest value corresponding to the white colour, using the SAOImage program DS9 colour palette SLS. The upper right panel shows the same density field as in the previous panel, but the phases randomly shifted. With shifting the phases of density waves some densities become negative, thus in this case colour codes are in the density interval ±3.5. Middle and lower panels show the wavelets w7, w6, w5, and w4 of the wedge. The middle left panel shows density waves of scales approximately equal to half of the box size, each following panel shows waves with half the length. Wavelet densities used in plotting have both negative and positive values, i.e., they correspond to under- and over-densities of matter, colour coding is linear. Supercluster numbers according to the catalogue by Einasto et al. (2003) are shown in the middle right panel w6.
Current usage metrics show cumulative count of Article Views (full-text article views including HTML views, PDF and ePub downloads, according to the available data) and Abstracts Views on Vision4Press platform.
Data correspond to usage on the plateform after 2015. The current usage metrics is available 48-96 hours after online publication and is updated daily on week days.
Initial download of the metrics may take a while.