Fig. 3
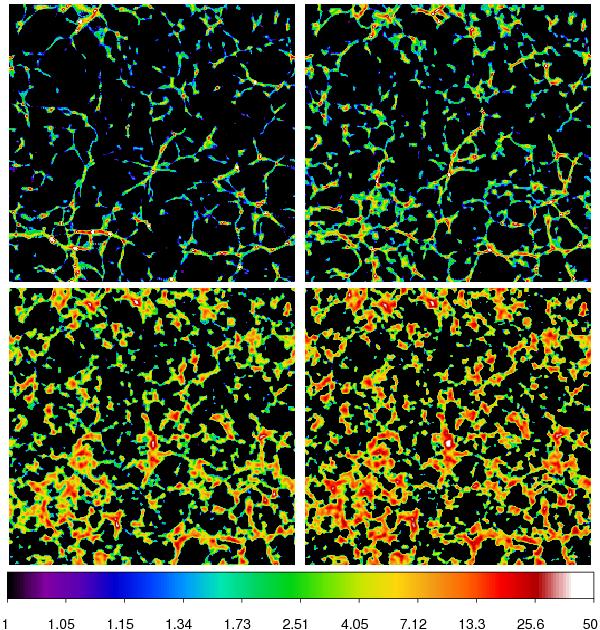
Evolution of the high-resolution density field of the model M256, at k = 153 coordinate. Upper panels are for z = 0 and z = 1, lower panels for z = 5 and z = 10. The densities are expressed in the logarithmic scale; this allows to see better the evolution in low-density regions. Only over-densities are shown, i.e., lower density limit for plotting is taken 1. Upper densities for plotting with the DS9 package, corresponding to white, are 50, 25, 5, and 2.5 for redshifts 0, 1, 5, and 10, respectively. Colour codes shown at the bottom correspond to redshift z = 0 (upper left panel).
Current usage metrics show cumulative count of Article Views (full-text article views including HTML views, PDF and ePub downloads, according to the available data) and Abstracts Views on Vision4Press platform.
Data correspond to usage on the plateform after 2015. The current usage metrics is available 48-96 hours after online publication and is updated daily on week days.
Initial download of the metrics may take a while.