Fig. 6
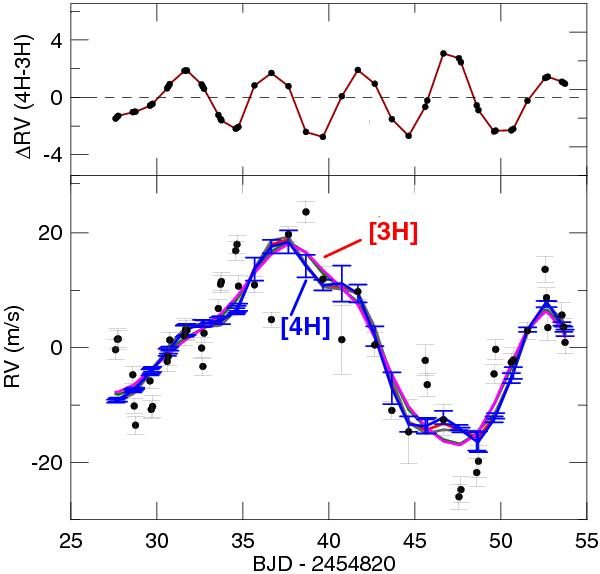
Bottom: star activity resulting from the high-pass filter. The labels [4H] and [3H] indicate the results obtained respectively with 4 and 3 harmonics. The color coding of the components of these curves, when visible, is the same as in Fig. 7. The dots indicate the measured radial velocities with their error bars. The error bars of the activity estimated with the 4-harmonic high-pass filter are also shown. Top: difference between the results labeled 4H and 3H.
Current usage metrics show cumulative count of Article Views (full-text article views including HTML views, PDF and ePub downloads, according to the available data) and Abstracts Views on Vision4Press platform.
Data correspond to usage on the plateform after 2015. The current usage metrics is available 48-96 hours after online publication and is updated daily on week days.
Initial download of the metrics may take a while.