Fig. 3
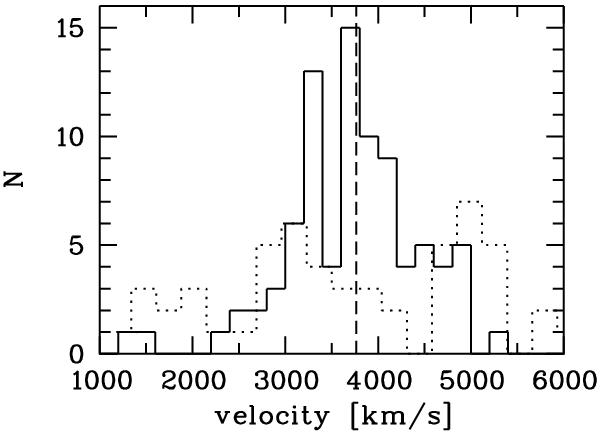
A comparison of the velocity distributions of globular clusters (GCs; solid histogram) and planetary nebulae (PNe; dashed histogram) from Ventimiglia et al. (2011). The vertical dashed line at 3765 km s-1 indicates the mean of all GC velocities. The GCs have projected galactocentric distances that are smaller than 65 kpc in order to match the radial range of PNe. There are striking differences whose origin is not yet understood.
Current usage metrics show cumulative count of Article Views (full-text article views including HTML views, PDF and ePub downloads, according to the available data) and Abstracts Views on Vision4Press platform.
Data correspond to usage on the plateform after 2015. The current usage metrics is available 48-96 hours after online publication and is updated daily on week days.
Initial download of the metrics may take a while.