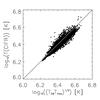
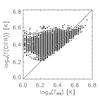
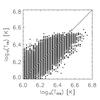
Fig. 9
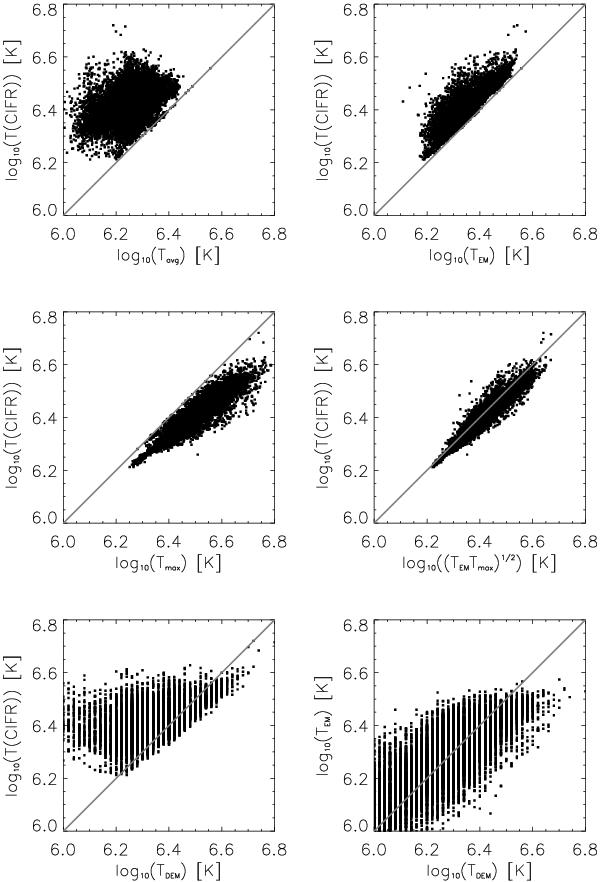
Scatterplots of the dependence of the diagnosed
T(CIFR) on the characteristics of the
temperature distribution in the best-fit model. These include
Tavg (top left),
TEM (top right),
Tmax (middle left),
 (middle right), and TDEM
(bottom left). The dependence of TEM
on TDEM is also plotted at the bottom
right.
(middle right), and TDEM
(bottom left). The dependence of TEM
on TDEM is also plotted at the bottom
right.
Current usage metrics show cumulative count of Article Views (full-text article views including HTML views, PDF and ePub downloads, according to the available data) and Abstracts Views on Vision4Press platform.
Data correspond to usage on the plateform after 2015. The current usage metrics is available 48-96 hours after online publication and is updated daily on week days.
Initial download of the metrics may take a while.