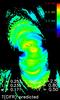
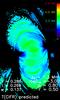
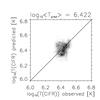
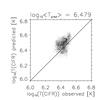
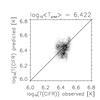
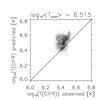
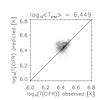
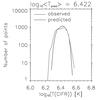
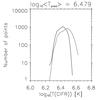
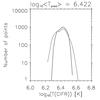
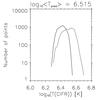
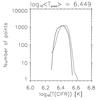
Fig. 5
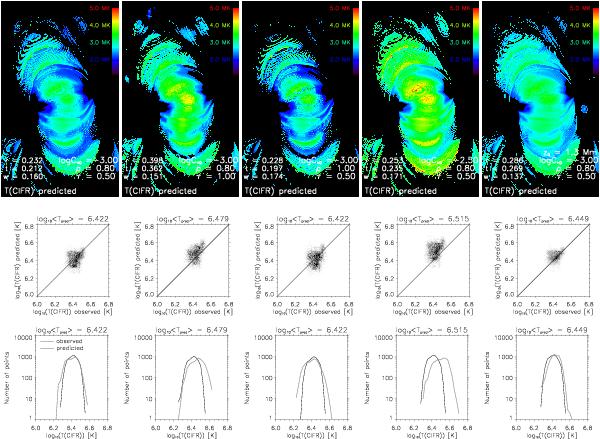
Temperature distributions derived from five various models using the CIFR method. Each column corresponds to a different model. The model parameters are listed in the images at the top. Top row: temperature distribution maps. Middle row: probability density function of the temperature distributions derived from the predicted and observed X-ray emission. Bottom row: temperature distribution histograms.
Current usage metrics show cumulative count of Article Views (full-text article views including HTML views, PDF and ePub downloads, according to the available data) and Abstracts Views on Vision4Press platform.
Data correspond to usage on the plateform after 2015. The current usage metrics is available 48-96 hours after online publication and is updated daily on week days.
Initial download of the metrics may take a while.