Fig. 1
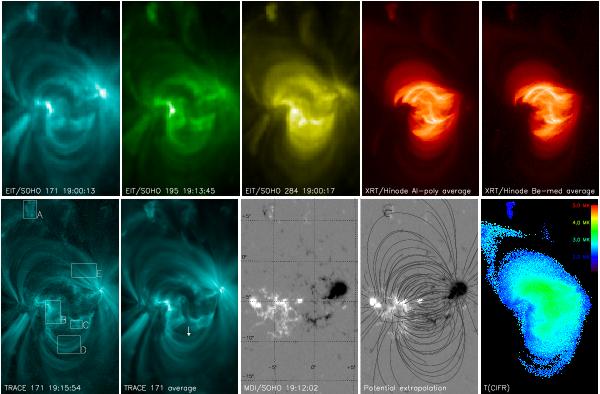
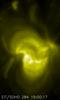
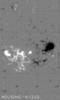
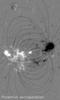
Active region NOAA 10963. Top row, left to right: EIT/SOHO snapshots in EIT 171, EIT 195, and EIT 284 filters, XRT Al-poly and Be-med temporal average over the 18:00–20:00 UT period. Bottom row, left to right: snapshot in TRACE 171 filter at 19:15:54 UT, TRACE 171 temporal average over the period of 16:00 to 23:00 UT, MDI/SOHO magnetogram with the disk coordinate system, potential extrapolation of the magnetic field overlaid on the MDI/SOHO magnetogram, and the temperature structure of the active region obtained using the CIFR method. EIT, XRT, and TRACE observations are scaled with the square-root of intensity to enhance areas of weaker emission, e.g. the secondary bipole located near the upper right corner of individual images. TRACE 171 observations were deconvolved to remove the stray light. MDI/SOHO magnetogram is saturated to values of ± 1000 G. The arrow in the TRACE average image denotes loops that are discussed in Sect. 4.1.


Current usage metrics show cumulative count of Article Views (full-text article views including HTML views, PDF and ePub downloads, according to the available data) and Abstracts Views on Vision4Press platform.
Data correspond to usage on the plateform after 2015. The current usage metrics is available 48-96 hours after online publication and is updated daily on week days.
Initial download of the metrics may take a while.