Free Access
Fig. B.1
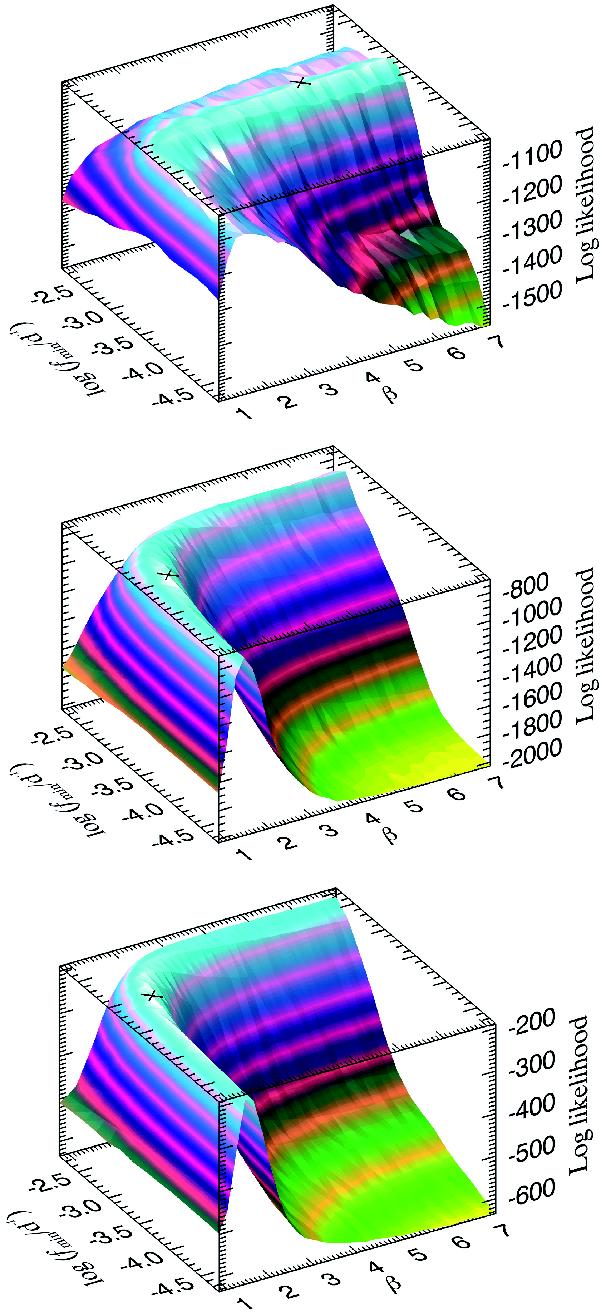
Logarithm of the likelihood for the real light curve being realised by red noise with a certain β and fmin. Top for the LSP, middle for the SF and bottom for the MFVF. The peaks located in the white shaded areas are marked with a black cross.
This figure is made of several images, please see below:
Current usage metrics show cumulative count of Article Views (full-text article views including HTML views, PDF and ePub downloads, according to the available data) and Abstracts Views on Vision4Press platform.
Data correspond to usage on the plateform after 2015. The current usage metrics is available 48-96 hours after online publication and is updated daily on week days.
Initial download of the metrics may take a while.