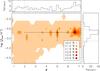
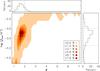
Fig. 7
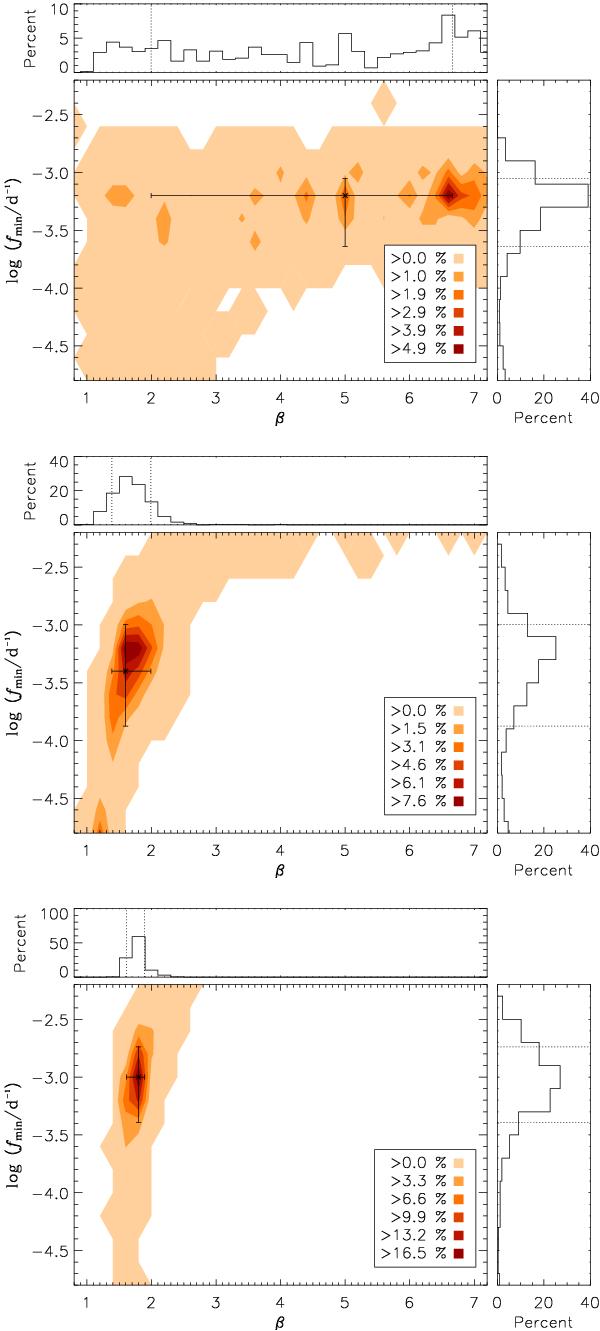
Distribution of maximum likelihood estimates of simulated light curves with parameters found for PKS 2155-304. The boundaries of the coloured areas are the contours which are quoted as fractions of the 5000 simulated light curves in the legends. The sub plots show the marginalised distributions which are calculated to obtain the 1σ error bars.
Current usage metrics show cumulative count of Article Views (full-text article views including HTML views, PDF and ePub downloads, according to the available data) and Abstracts Views on Vision4Press platform.
Data correspond to usage on the plateform after 2015. The current usage metrics is available 48-96 hours after online publication and is updated daily on week days.
Initial download of the metrics may take a while.