Fig. 6
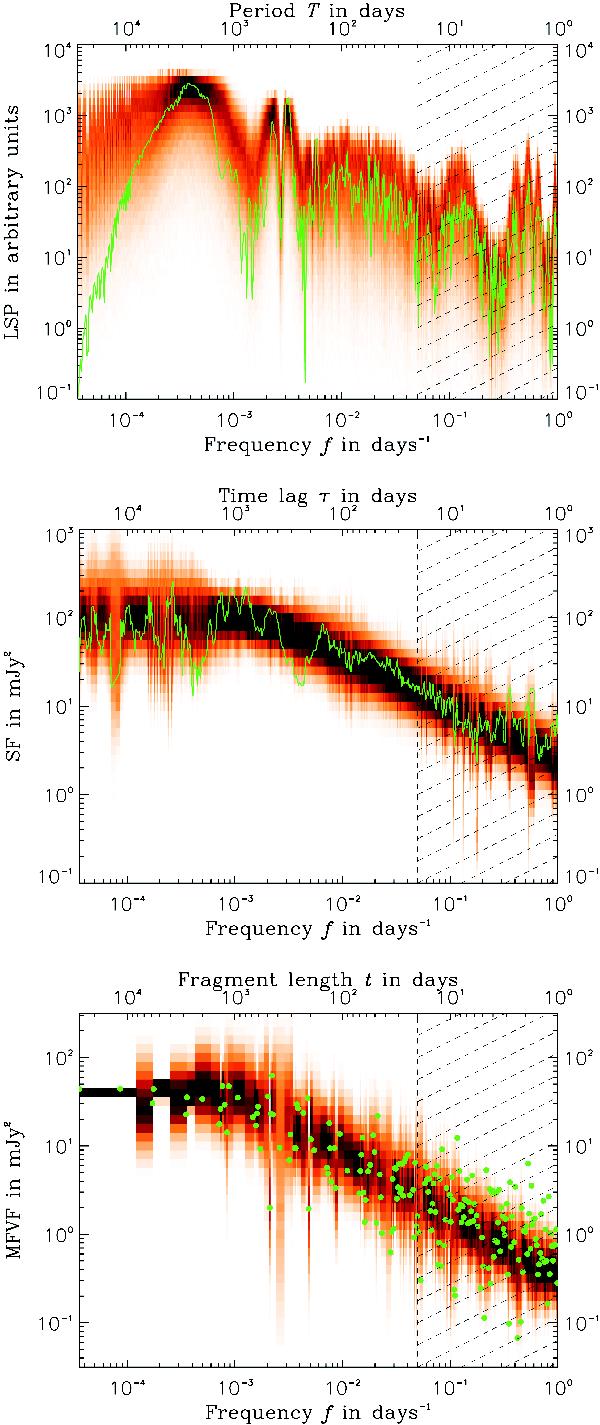
Normalised Lomb-Scargle periodogram (LSP), structure function (SF) and multiple fragments variance function (MFVF) (from top to bottom). The green lines/points are the measured results of the light curve of PKS 2155-304. The histograms in colour scale represent the PDFs obtained from simulated light curves with the best-fit parameter sets (β = 5.0, fmin = 10-3.2 d-1), (β = 1.6, fmin = 10-3.4 d-1) and (β = 1.8, fmin = 10-3.0 d-1) respectively. Only the bins at f < 0.05 d-1 are used for the maximum-likelihood method.
Current usage metrics show cumulative count of Article Views (full-text article views including HTML views, PDF and ePub downloads, according to the available data) and Abstracts Views on Vision4Press platform.
Data correspond to usage on the plateform after 2015. The current usage metrics is available 48-96 hours after online publication and is updated daily on week days.
Initial download of the metrics may take a while.