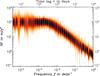
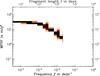
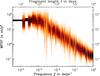
Fig. 3
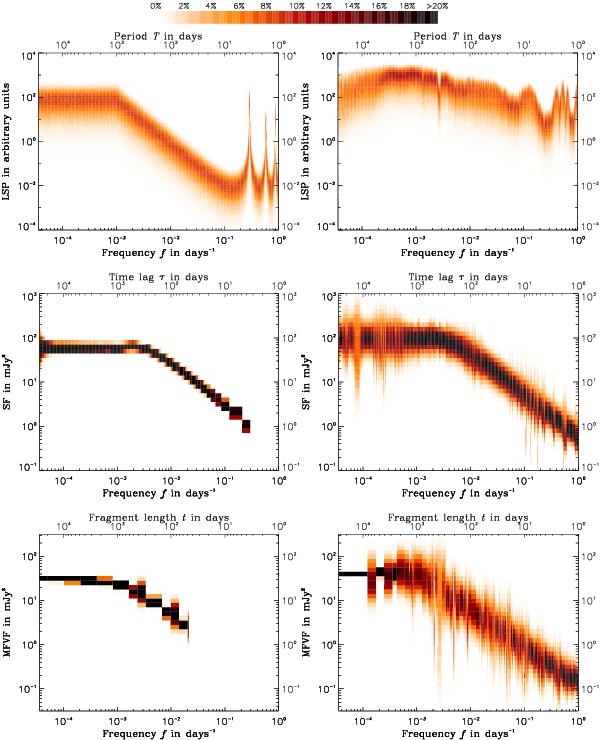
Two dimensional histograms of LSP, SF, and MFVF (from top to bottom) values of artificial light curves with β = 2.0 and fmin = 10-3 d-1. On the left side histograms are shown for the case of an even sampling of one measurement every 3.37 days while on the right side, the effects of a realistic (uneven) sampling and simulated instrumental noise are visible (see text for details).

Current usage metrics show cumulative count of Article Views (full-text article views including HTML views, PDF and ePub downloads, according to the available data) and Abstracts Views on Vision4Press platform.
Data correspond to usage on the plateform after 2015. The current usage metrics is available 48-96 hours after online publication and is updated daily on week days.
Initial download of the metrics may take a while.