Fig. 2
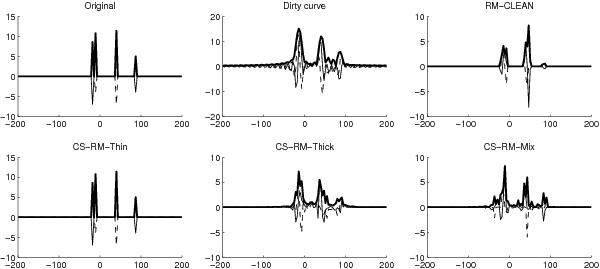
We have tested our methods on a Faraday dispersion function with four Faraday thin sources. From left to right in the first row are: a) original F(φ); b) dirty curve; c) RM-CLEAN. From left to right in the second row are: d) CS-RM-Thin; e) CS-RM-Thick; f) CS-RM-Mix. The thin solid line shows the real value, the dashed line the imaginary part, and the thick solid line the amplitude. All horizontal axis units are rad m-2, i.e. φ, and all vertical axis units are Jy m2 rad-1.
Current usage metrics show cumulative count of Article Views (full-text article views including HTML views, PDF and ePub downloads, according to the available data) and Abstracts Views on Vision4Press platform.
Data correspond to usage on the plateform after 2015. The current usage metrics is available 48-96 hours after online publication and is updated daily on week days.
Initial download of the metrics may take a while.