Fig. 9
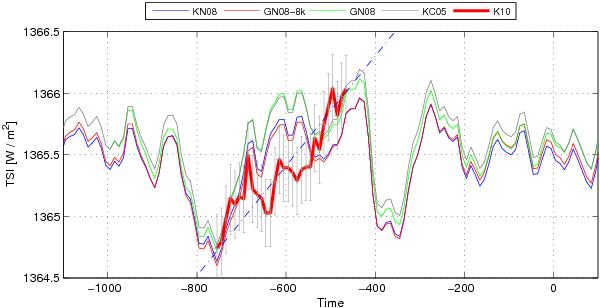
Comparison between the evolutions of the TSI after the grand minimum observed in approximately 765 BC and after the Maunder Minimum. The figure follows the format of Fig. 5a. The 10-year averaged SATIRE-T reconstruction (thick red line) is shifted in time by 2465 years in order to match the minimum value observed in 765 BC. The dashed blue line connects the beginning and the end of the SATIRE-T reconstruction and emphasizes the roughly linear rise in irradiance sind the end of the Maunder Minimum.
Current usage metrics show cumulative count of Article Views (full-text article views including HTML views, PDF and ePub downloads, according to the available data) and Abstracts Views on Vision4Press platform.
Data correspond to usage on the plateform after 2015. The current usage metrics is available 48-96 hours after online publication and is updated daily on week days.
Initial download of the metrics may take a while.