Fig. 7
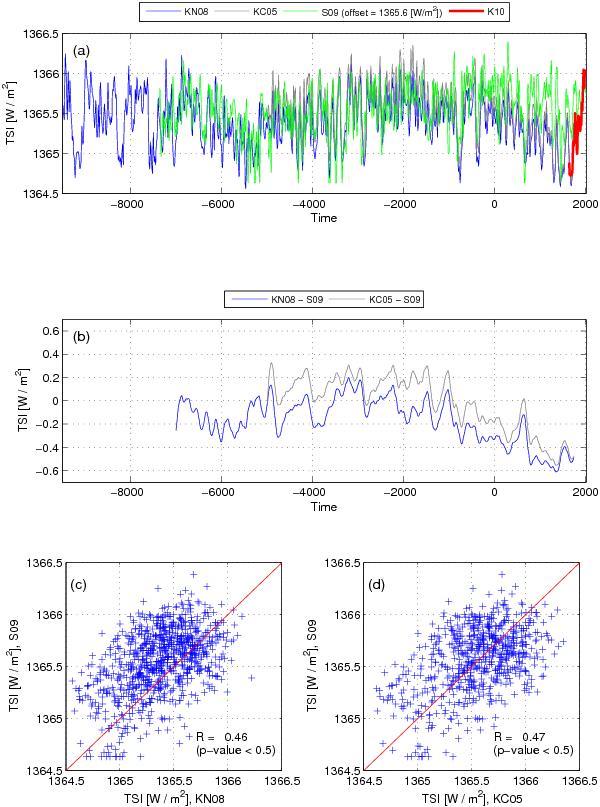
a) Comparison between the TSI reconstruction by Steinhilber et al. (2009) (S09; VADM; green line) and two TSI reconstructions obtained in this paper based on VADM and VDM paleomagnetic reconstructions by Knudsen et al. (2008) (KN08; VADM; blue line) and Korte & Constable (2005) (KC05; VDM; gray line), respectively. For reference, 10-year running means of the SATIRE-T reconstruction are displayed from aprroximately 1640 to the present (K10, thick red line). b) Differences between 120-year running means of the models based on 14C and 10Be records. c) Scatter plot TSI-S09 versus TSI-KN08. d) Scatter plot TSI-S09 versus TSI-KC05.
Current usage metrics show cumulative count of Article Views (full-text article views including HTML views, PDF and ePub downloads, according to the available data) and Abstracts Views on Vision4Press platform.
Data correspond to usage on the plateform after 2015. The current usage metrics is available 48-96 hours after online publication and is updated daily on week days.
Initial download of the metrics may take a while.