Fig. 6
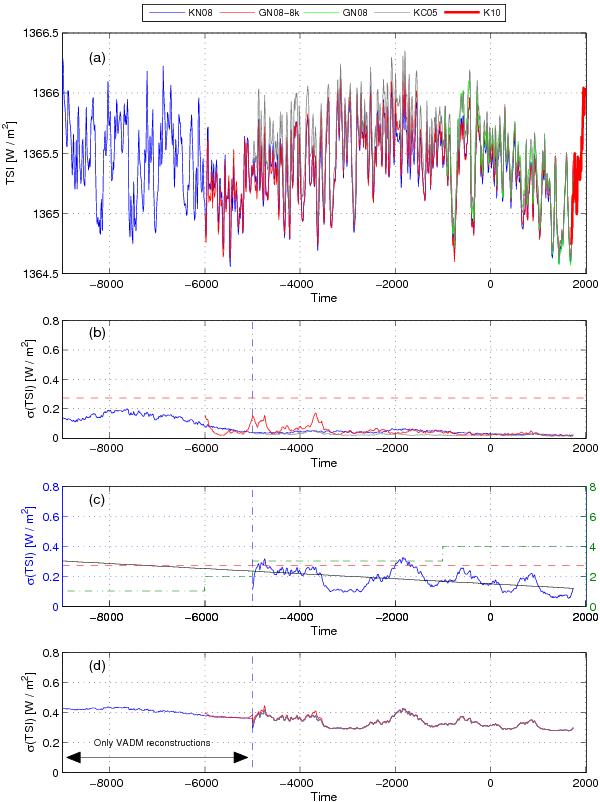
Reconstructions of the total solar irradiance for the Holocene. The figure has the same structure as Fig. 5, but for the period 9495 BC to the present. See the caption of Fig. 5 for more information. While the green line in panel c) indicates the number of reconstructions employed to compute the uncertainty of the TSI due to the uncertainty of the evolution of the geomagnetic dipole moment, the black line represents the long-term trend of the uncertainty of the evolution of the geomagnetic dipole moment (y = −1.7 × 10 − 5 ∗ t + 0.15 [W/m2]). The period for which only VADM reconstructions are available is indicated in panel d).
Current usage metrics show cumulative count of Article Views (full-text article views including HTML views, PDF and ePub downloads, according to the available data) and Abstracts Views on Vision4Press platform.
Data correspond to usage on the plateform after 2015. The current usage metrics is available 48-96 hours after online publication and is updated daily on week days.
Initial download of the metrics may take a while.