Fig. 8
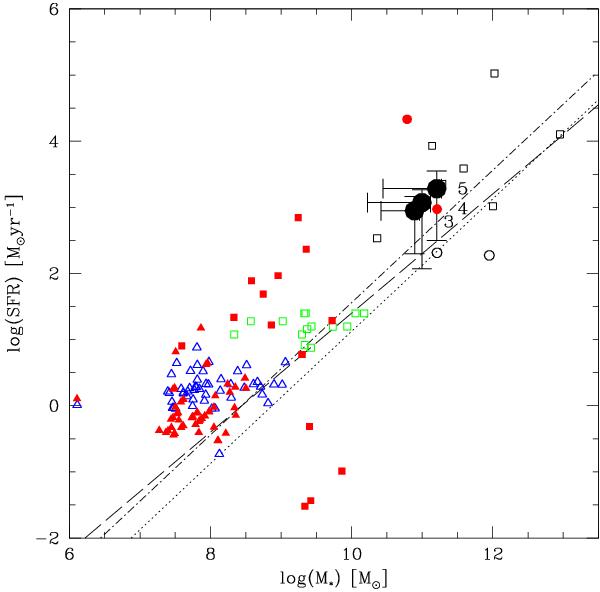
Mass-SFR relation of the z, Y, and J-dropout galaxies resulting from 103 Monte Carlo simulations compared to the properties of z ~ 6–8 galaxies from surveys analysed by Schaerer & de Barros (2010). The most likely high-z candidates based on photometric redshifts with a luminosity prior, namely Y3, Y4, and Y5, are identified and displayed by large black dots. The positions derived for the other optical-dropouts in this study, if at high-z, are indicated by black open squares for comparison. Open symbols (squares, triangles) show the “standard” SFR(UV) value (not corrected for extinction) versus mass derived from the SB2010 reference model for objects from their bright, intermediate, and faint samples, respectively. Red filled symbols show the best-fit model SFR and M ⋆ values when assuming τ ≥ 10 Myr (model 1 in SB2010). Circles correspond to the two objects from Capak et al. (2011). The dotted (dash-dotted) lines show the locus for SFR = const. from z = ∞ (10) to 7 corresponding to SSFR = 1.3 (3.6) Gyr-1. The dashed line shows the relation found by Daddi et al. (2007) for z ~ 2 star-forming galaxies. The large spread in SFR is in particular due to a wide variety of exponentially decreasing star-formation histories beeing allowed. Note that if at high redshift the properties of our galaxies follow the trends observed for less massive/bright objects a high redshift.
Current usage metrics show cumulative count of Article Views (full-text article views including HTML views, PDF and ePub downloads, according to the available data) and Abstracts Views on Vision4Press platform.
Data correspond to usage on the plateform after 2015. The current usage metrics is available 48-96 hours after online publication and is updated daily on week days.
Initial download of the metrics may take a while.