Fig. 5
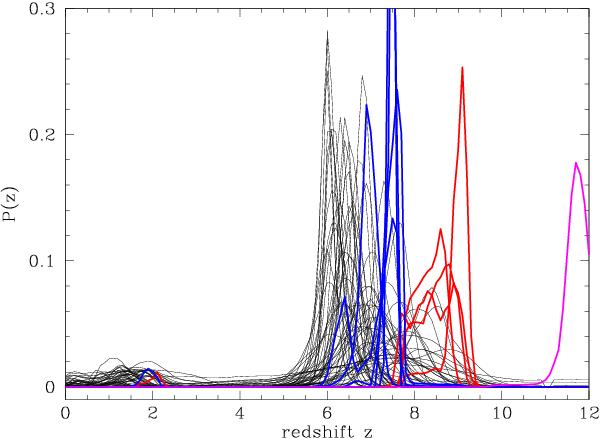
Redshift probability distributions, P(z) for our objects computed using standard templates (BC solar metallicity, no emission lines). Objects Y1, Y3, Y6, Y8, and z1 are shown in blue, Y2, Y4, Y5, and Y7 in red, and J1 in magenta. Black lines show P(z) of other z ~ 6–8 galaxies from HST surveys using NICMOS and WFC3 from the analysis of Schaerer & de Barros (2010), namely Gonzalez et al. (2010) and McLure et al. (2010) sample.
Current usage metrics show cumulative count of Article Views (full-text article views including HTML views, PDF and ePub downloads, according to the available data) and Abstracts Views on Vision4Press platform.
Data correspond to usage on the plateform after 2015. The current usage metrics is available 48-96 hours after online publication and is updated daily on week days.
Initial download of the metrics may take a while.