Fig. 7
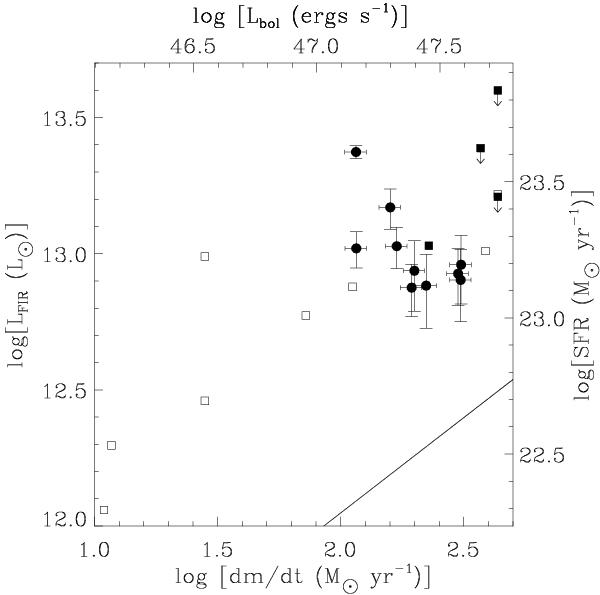
The relationship between Far-Infrared (FIR) luminosity and the mass accretion rate onto the black hole for sub-mm detected QSOs (filled circles with error bars). The equivalent axes of star formation rate (SFR) and bolometric luminosity are indicated on the right and top of the plot, respectively. The sub-mm QSOs are close to the highest end of the relationship between the two quantities found to be valid over 6 orders of magnitude (black line in the figure; Trakhtenbrot & Netzer 2010). QSOs at z ~ 2 observed in the mid-IR by Spitzer (Lutz et al. 2008) are plotted as squares; filled symbols are used for the QSOs in common with our sample.
Current usage metrics show cumulative count of Article Views (full-text article views including HTML views, PDF and ePub downloads, according to the available data) and Abstracts Views on Vision4Press platform.
Data correspond to usage on the plateform after 2015. The current usage metrics is available 48-96 hours after online publication and is updated daily on week days.
Initial download of the metrics may take a while.