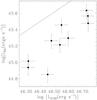
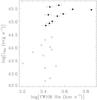
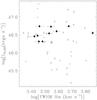
Fig. 5
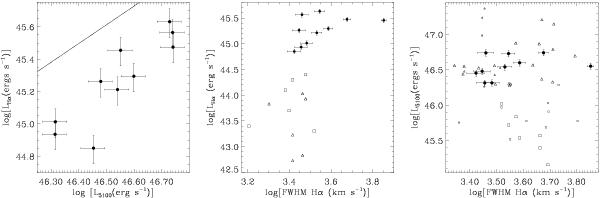
The relationship between continuum luminosity (λLλ at 5100 Å; see text), and the width and luminosity of the broad component (ILR+VBLR) of the Hα line. QSOs in our sample are plotted with filled circles and their corresponding 1σ error bars. The line in the left panel corresponds to the relationship between these quantities found by Greene & Ho (2005) in a sample of SDSS galaxies (see text). In the middle panel data from Alexander et al. (2008) on the sub-mm detected (SMG) galaxies in the Chandra Deep Field North are shown as triangles (obscured ULIRGs with broad Paα) and squares (SMGs with broad Hα or broad Hβ). The right panel includes the QSO samples of Shemmer et al. (2004, triangles) and Netzer et al. (2007, squares); quantities for these were recalculated using the scaling relations and cosmology used in this work, and smaller symbols are used for QSOs with redshifts >2.5.
Current usage metrics show cumulative count of Article Views (full-text article views including HTML views, PDF and ePub downloads, according to the available data) and Abstracts Views on Vision4Press platform.
Data correspond to usage on the plateform after 2015. The current usage metrics is available 48-96 hours after online publication and is updated daily on week days.
Initial download of the metrics may take a while.