Fig. 3
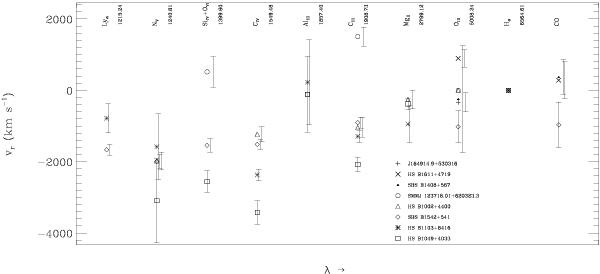
Velocity offsets of rest-frame UV, rest-frame optical, and CO emission lines for sub-mm detected QSOs. The QSOs plotted are present in at least two of the following: our sample, the Coppin et al. (2008) sample, and the SDSS spectroscopic database. The lines are ordered left to right in increasing rest wavelength, individual lines are labeled, and different symbols, as indicated on the figure, are used for each QSO. Only lines with reliable fits to their line centers are included (see text). The QSO systemic velocity is assumed to be that of the intermediate-width (ILR) component of the Hα line if available, or else that of the [O iii] line from Coppin et al. (2008). Error bars have been displaced slightly along the x axis for better visibility. The QSO SBS B1542+541 is in our sample, Coppin et al. (2008), and has an SDSS spectrum. Two QSOs, HS B1049+4033 and HS B1103+6416, are both in our sample and have SDSS spectra. Two QSOs, HS B1002+4400 and SMM J123716.01+620323.3, are both in Coppin et al. (2008) and have SDSS spectra. Three additional QSOs, SBS B1408+567, HS B1611+4719, and J164914.9+530316, are both in our sample and that of Coppin et al. (2008).
Current usage metrics show cumulative count of Article Views (full-text article views including HTML views, PDF and ePub downloads, according to the available data) and Abstracts Views on Vision4Press platform.
Data correspond to usage on the plateform after 2015. The current usage metrics is available 48-96 hours after online publication and is updated daily on week days.
Initial download of the metrics may take a while.