Fig. 4
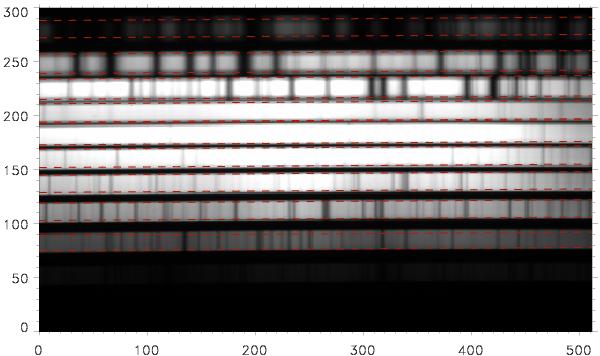
Example of a calibration image with the cross-dispersed spectral orders. Each band enclosed with dashed lines represents one of the overlapping orders in the spectrograph (order-isolation filters are removed for these operations) that we have used for this work, ranging from 470 (bottom) to 1413 (top) nm. Spectral lines are visible in the data. The central orders have been saturated in the figure to show the weaker ones at the top and the bottom.
Current usage metrics show cumulative count of Article Views (full-text article views including HTML views, PDF and ePub downloads, according to the available data) and Abstracts Views on Vision4Press platform.
Data correspond to usage on the plateform after 2015. The current usage metrics is available 48-96 hours after online publication and is updated daily on week days.
Initial download of the metrics may take a while.