Fig. 8
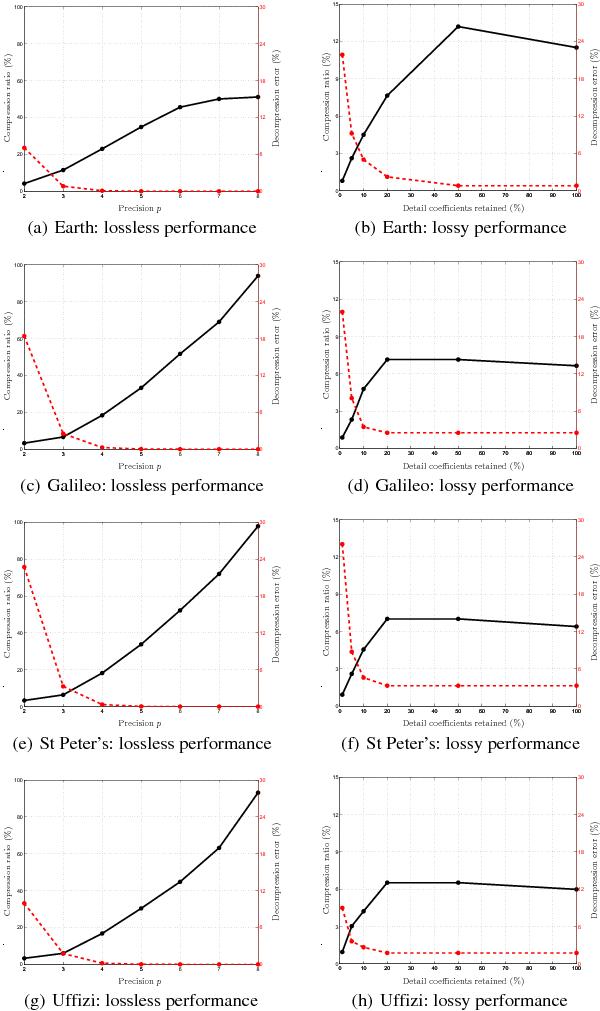
Compression performance for lossy compression applications. Each row of panel shows performance plots for various data-spheres. The first column of panels shows the trade-off between compression ratio and decompression fidelity with precision parameter p for lossless compression. The second column of panels shows the same trade-off, but with respect to the number of detail coefficients retained in the lossy compression. A precision parameter of p = 3 is used for all lossy compression results illustrated here. Compression ratio (solid black line; left axis) and decompression error (dashed red line; right axis) are defined in the caption of Fig. 4.
Current usage metrics show cumulative count of Article Views (full-text article views including HTML views, PDF and ePub downloads, according to the available data) and Abstracts Views on Vision4Press platform.
Data correspond to usage on the plateform after 2015. The current usage metrics is available 48-96 hours after online publication and is updated daily on week days.
Initial download of the metrics may take a while.