Fig. 7
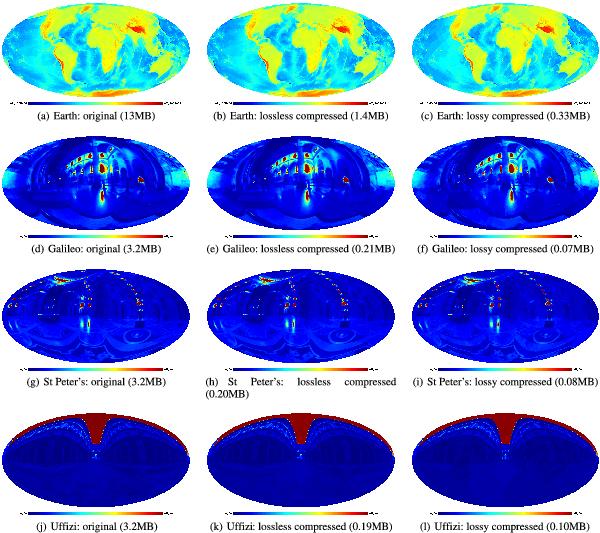
Compressed data for lossy compression applications (data-spheres are displayed using the Mollweide projection). Each row of panels shows the original, lossless and lossy compressed data-spheres. File sizes for each data-sphere are also specified. The lossless compressed data shown in the second column of panels is performed with a precision parameter of p = 3. The lossy compressed data shown in the third column of panels is performed by retaining 5% of detail coefficients only and including a RLE stage. The full dynamic range of these images may not be visible in printed versions of this figure, hence this figure is best viewed online.
Current usage metrics show cumulative count of Article Views (full-text article views including HTML views, PDF and ePub downloads, according to the available data) and Abstracts Views on Vision4Press platform.
Data correspond to usage on the plateform after 2015. The current usage metrics is available 48-96 hours after online publication and is updated daily on week days.
Initial download of the metrics may take a while.