Fig. 6
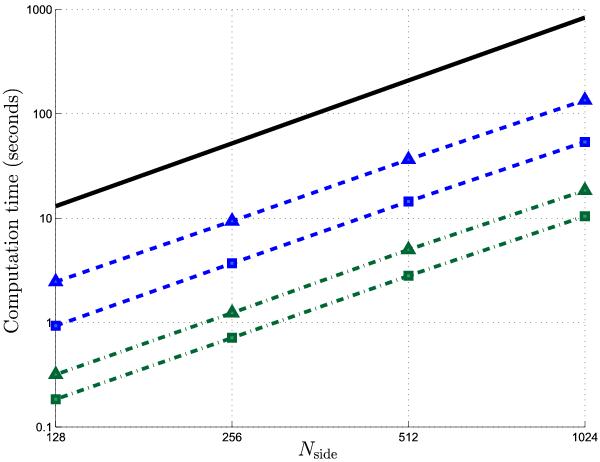
Computation time required to compress (blue/dashed line) and decompress
(green/dot-dashed line) simulated Gaussian CMB data of various
resolution Nside. Computation times are averaged over
five simulated Gaussian CMB maps and are shown for precisions parameters
p = 3 (squares) and p = 5 (triangles).
 scaling
is shown by the heavy black/solid line.
scaling
is shown by the heavy black/solid line.
Current usage metrics show cumulative count of Article Views (full-text article views including HTML views, PDF and ePub downloads, according to the available data) and Abstracts Views on Vision4Press platform.
Data correspond to usage on the plateform after 2015. The current usage metrics is available 48-96 hours after online publication and is updated daily on week days.
Initial download of the metrics may take a while.