Fig. 5
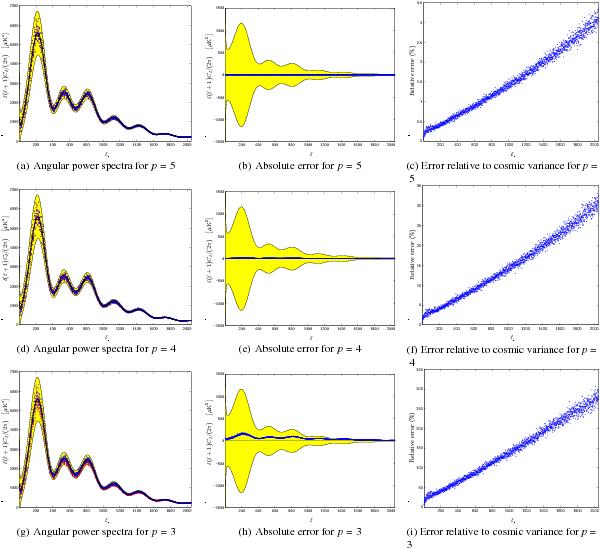
Reconstructed angular power spectrum of compressed CMB data at resolution Nside = 1024. Each row of panels shows the reconstructed power spectrum and errors for a particular compression precision parameter p. In the first column of panels, the power spectrum reconstructed from the original CMB data are given by the red dots, the power spectrum reconstructed from the compressed CMB data are given by the blue dots and the underlying power spectrum of the simulated model is shown by the solid black line, with three standard deviation cosmic variance regions shaded in yellow. Note that in some instances the red and blue dots align closely and may not both be visible. In the second column of panels, the absolute error between the power spectra reconstructed from the original and compressed CMB data is given by the blue dots, with three standard deviation cosmic variance regions shaded in yellow. In the third column of panels, the absolute error between the power spectra reconstructed from the original and compressed CMB data is expressed as a percentage of cosmic variance. Note that the scale of the vertical axis changes by an order of magnitude between each row of the third column of panels.
Current usage metrics show cumulative count of Article Views (full-text article views including HTML views, PDF and ePub downloads, according to the available data) and Abstracts Views on Vision4Press platform.
Data correspond to usage on the plateform after 2015. The current usage metrics is available 48-96 hours after online publication and is updated daily on week days.
Initial download of the metrics may take a while.