Fig. 9
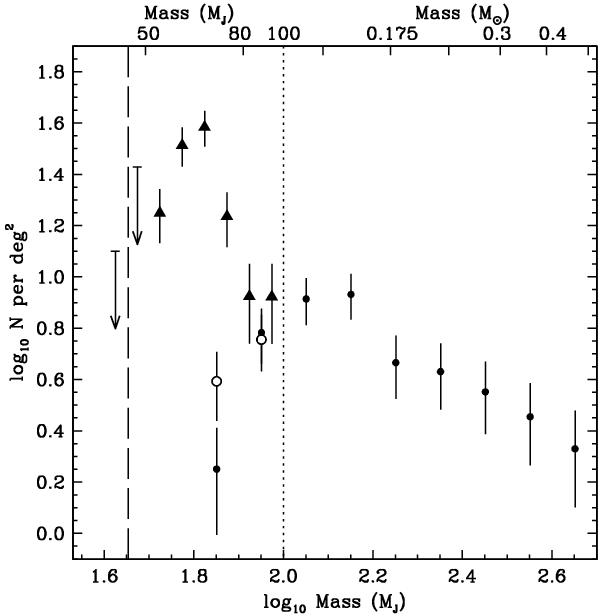
MF of Praesepe based on our survey LBT iz and Ω2k JKs photometry (triangles), compared with that from Boudreault et al. (2010) (open dots assuming a dusty atmosphere and filled dots assuming a dust-free atmosphere). Error bars are Poissonian arising from the finite number of objects observed in each bin, except for the last bin, for which the error bar is derived from the linear fit. The vertical thin dotted line is the mass limit above which detector saturation occurs in the i and z-bands. The vertical thin long-dashed line is the mass at the 5σ detection limit of our optical LBT data.
Current usage metrics show cumulative count of Article Views (full-text article views including HTML views, PDF and ePub downloads, according to the available data) and Abstracts Views on Vision4Press platform.
Data correspond to usage on the plateform after 2015. The current usage metrics is available 48-96 hours after online publication and is updated daily on week days.
Initial download of the metrics may take a while.